Before asking how well a treatment worked, ask who could enter the study and whose information reached the analysis. A participant-flow diagram looks straightforward: people enter, receive an assignment and move toward follow-up. Yet each stage changes the question a number can answer. A completion count describes movement through a research process; interpreting a treatment effect requires information about outcomes and their comparison. Reading those layers separately makes a study more useful for a medical discussion.
This analysis examines the daily tadalafil paper through that lens. We inspected its primary methods, participant-flow, safety and funding sections, then checked current official prescribing information. The chart shows reported participation counts; the worked examples below are deliberately invented to explain the arithmetic. They are not additional study results. Keeping that boundary visible lets us investigate missing information without pretending that an illustrative calculation reconstructs what happened to particular participants.
Reading the evidence
- The study in context
- Porst’s randomized placebo comparison tested oral tadalafil 5/10 mg daily for 12–15 weeks, excluding prior ineffective sildenafil treatment. Nine stopped for adverse events. Lilly ICOS funded it; company affiliations and Lilly statistical/writing support were disclosed. Missing IIEF erectile-function domain scores used last-observation-carried-forward.
Sources: Porst 2006
- Choose the population first
- A percentage needs a named denominator before it can answer a question. Entry, assignment and completion are different membership rules.
Sources: Porst 2006
- Keep observation separate from response
- Having a recorded visit or questionnaire does not, by itself, establish benefit. Define the outcome separately from the availability of a record.
Sources: Porst 2006
- Identify every assumption
- Replacing an unobserved result with an assumed value creates an analysis convention. It does not turn that value into an observation.
Sources: Porst 2006
- Give each source its proper job
- A historical experiment, current prescribing information and a service review answer different questions. Their conclusions should remain attached to those questions.
Sources: Porst 2006; Cialis label; FDA compounding guidance
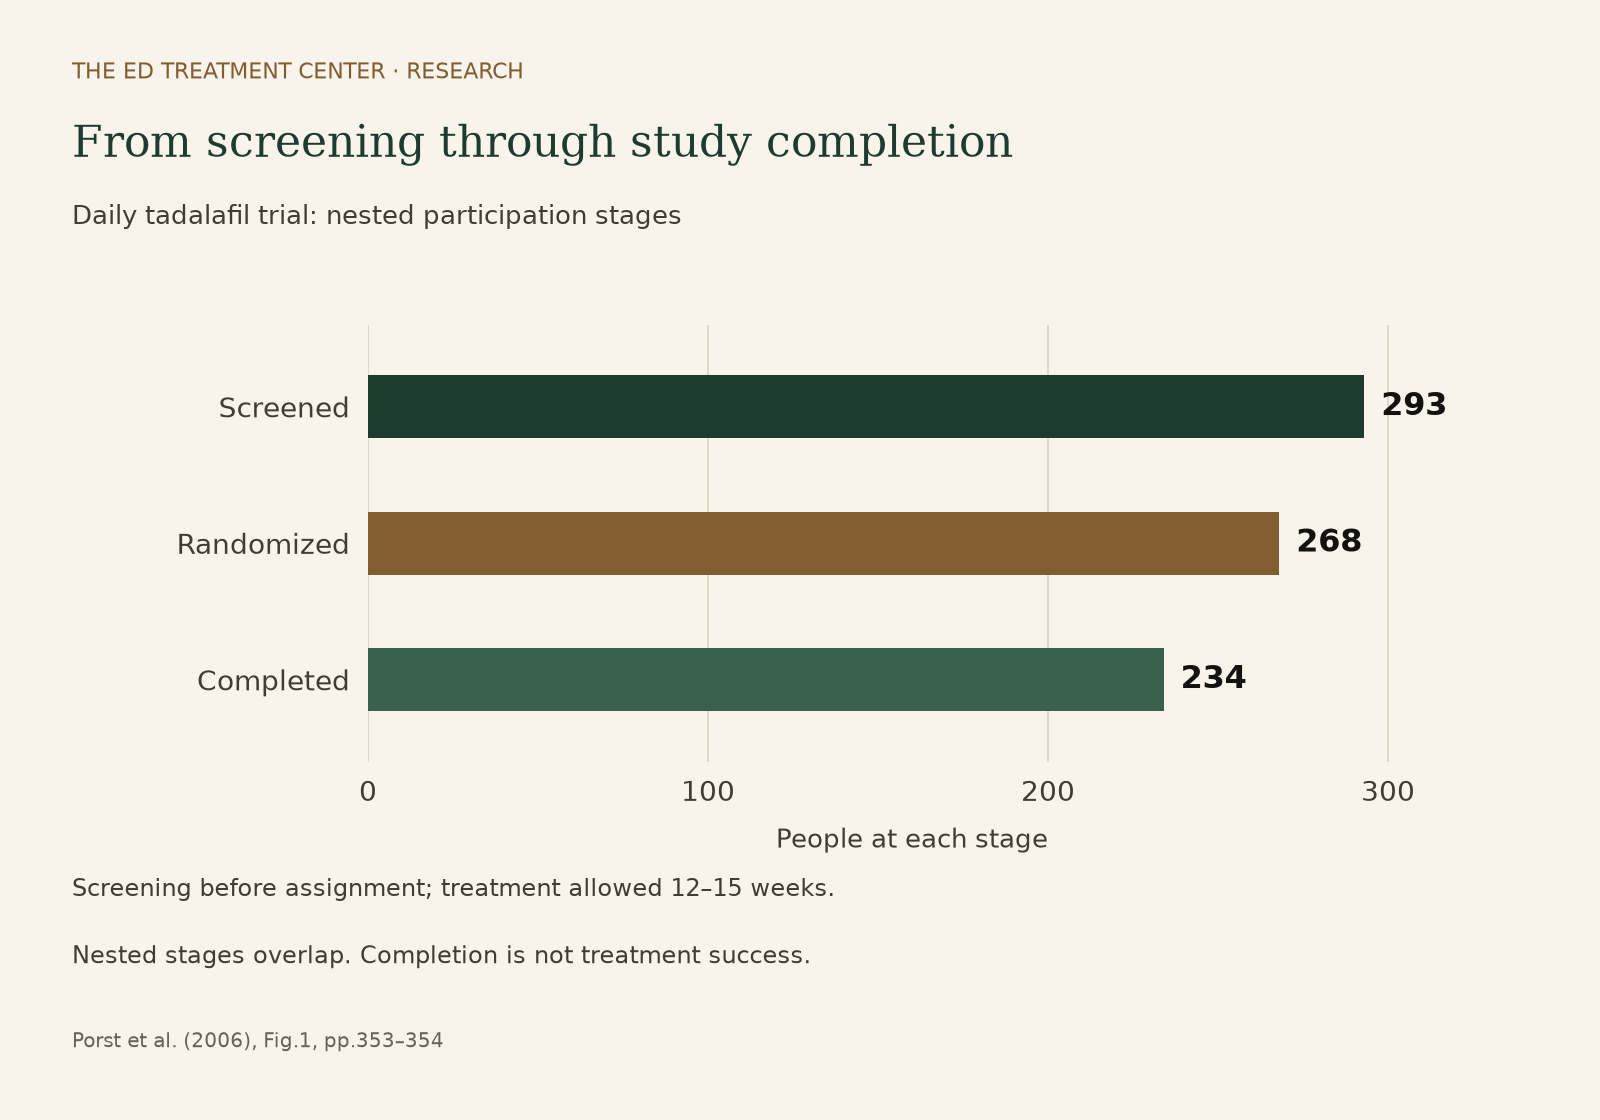
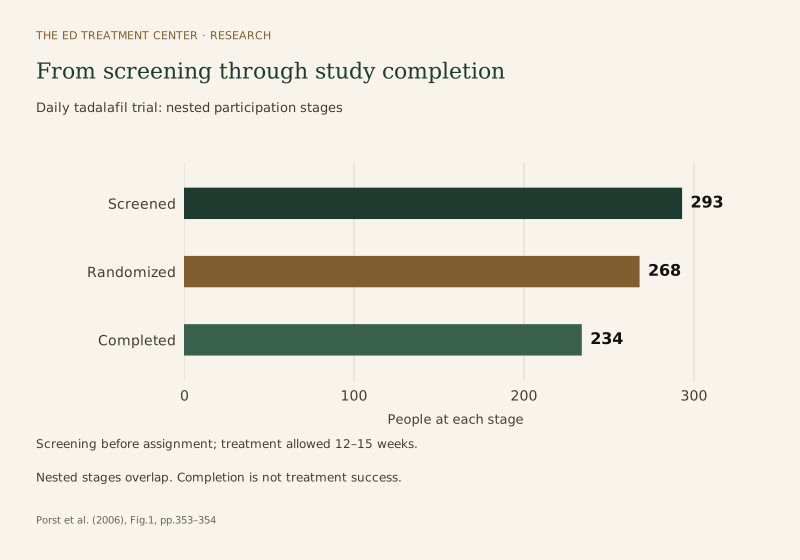
Nested participation stages; completion does not measure treatment success.
The plot does not establish why each person left or how treatment worked.
Sources: Porst 2006
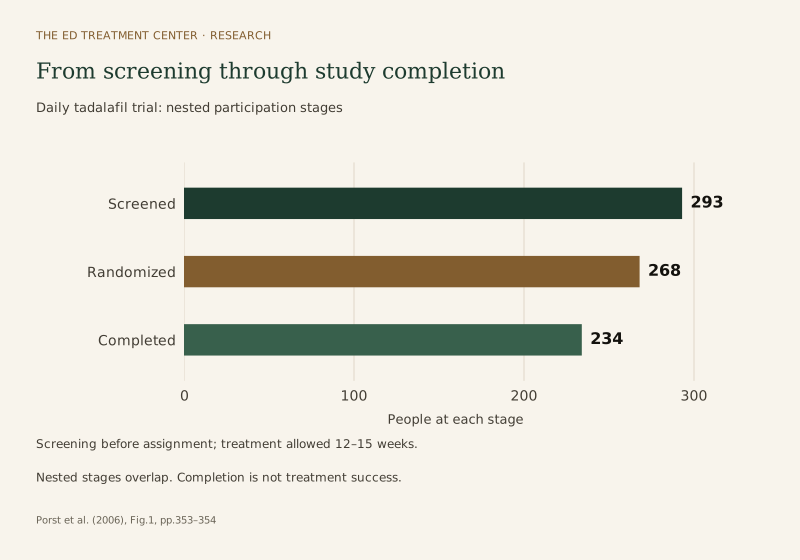
| Stage | People | Relationship |
|---|---|---|
| Screened | 293 | Entry stage |
| Randomized | 268 | Subset of screened |
| Completed | 234 | Subset of randomized |
Read a flow chart as membership, not a scoreboard
Begin by writing a verb beside each stage: assessed, assigned, followed or measured. These verbs describe different actions. A person can belong to several successive stages without becoming several people. Imagine placing a smaller transparent circle inside a larger one. Counting both circles and adding their totals counts the inner members twice. The same reasoning applies whenever a figure tracks a cohort through successive gates. The useful comparison is between stages, with an explanation of their relationship, rather than a grand total made by adding every box.
A flow diagram also leaves questions open by design. It may describe where observations become available without describing the quality of every observation. For reading purposes, keep a separate column for the evidence needed next: an outcome definition, a time point, a comparison group or a rule for incomplete records. This turns the diagram into a map of questions. Our guide to reading ED advice online offers a useful companion framework for keeping the question attached to the claim. A visually large final bar should not bypass that work.
Sources: Porst 2006
Two denominators can describe the same invented project
Consider an entirely hypothetical project with 120 people screened, 90 assigned and 72 completing follow-up. None of these numbers comes from the tadalafil study. Among those assigned, the completion fraction is 72 divided by 90, or 80%. Among those screened, the fraction reaching completion is 72 divided by 120, or 60%. Both calculations can be correct because their starting populations differ. One follows people after assignment; the other describes the whole path from screening. Changing the denominator changes the question even when the numerator stays fixed.
Now imagine a headline announcing that completion was either 80% or 60% without naming the starting group. The reader cannot resolve the apparent disagreement by choosing the more impressive number. The repair is to restore the missing population. This is a practical habit for scientific reading: translate every percentage into “these people, out of those people, at this stage.” The table is an original worksheet for the invented project. It shows how a compact label can prevent a correct fraction from being used to answer a different question.
| Question | Calculation | Meaning |
|---|---|---|
| Completion after assignment | 72 / 90 = 80% | Assigned people who reached follow-up |
| Completion after screening | 72 / 120 = 60% | Screened people who reached follow-up |
| Entry into assignment | 90 / 120 = 75% | Screened people who were assigned |
Sources: Porst 2006
Missing results are not automatically negative results
Extend the invented project by imagining that 36 of its 72 completers meet a predefined response criterion. The observed response fraction among completers is 36 divided by 72, or 50%. Dividing the same 36 by all 90 assigned people gives 40%, but describing that as an overall response estimate requires a rule for the 18 unobserved people. If the rule treats every missing result as nonresponse, say so. The smaller percentage now contains an assumption as well as observations. It does not demonstrate that those absent people actually failed to respond.
For a simple sensitivity exercise, suppose instead that all 18 unobserved people met the criterion. The assigned-group fraction would be 54 divided by 90, or 60%. These hypothetical extremes show how the unresolved records can matter; they are not credible estimates merely because they are arithmetically possible. Their purpose is to expose dependence on an assumption. To narrow the uncertainty, a reader would need additional information about the missing results or a justified analysis strategy. The arithmetic alone cannot supply either, and these invented percentages must never be substituted for the study’s findings.
Sources: Porst 2006
Eligibility and random assignment solve different problems
An original nonmedical example helps separate two decisions that are often compressed into one word. Suppose a training project admits only people who have already completed an introductory course. It then assigns eligible volunteers randomly to two teaching formats. That allocation can support a fair comparison of the formats within the admitted group. It does not make the group a random sample of everyone who might someday want training. The admission rule still determines which starting experiences are represented. Changing the rule could change the practical question the project addresses.
Apply that distinction as a reading method, not as a claim that a particular exclusion invalidates a study. Ask first what the eligibility rule selected, then what random allocation compared. When considering another person or setting, identify the specific difference rather than dismissing all research as irrelevant. A useful medical-history question concerns whether the evidence actually represents the circumstance being discussed. The companion analysis of who entered the sildenafil studies examines composition from another direction. Neither paper becomes a direct comparison between the two medicines simply because both discuss erectile dysfunction.
Sources: Porst 2006; Goldstein 1998
Give every missing record a precise description
Create four separate boxes in a reading notebook: no further follow-up, treatment discontinued, an unwanted event reported, and a particular questionnaire answer absent. These descriptions need not refer to the same event. As a logical example, someone could attend a visit yet leave one question blank. Another person could stop a treatment but still provide follow-up information. A third might report an unwanted event while continuing to participate. These examples describe possible record structures; they are not accounts of participants in this trial or estimates of how often any pattern occurred.
The distinction matters when interpreting a gap between adjacent bars. Subtraction reveals how many records are outside the later set, provided the sets are defined consistently. It does not reveal the reason for each absence. A sound explanation therefore needs more than the difference: it needs categories, definitions and an account of whether those categories overlap. If that information is unavailable, record the gap as unexplained at that level. Do not turn a missing explanation into a reassuring story or an alarming one. Both would add information the counts themselves do not contain.
Sources: Porst 2006
An analysis rule changes the calculation, not the past
Consider three invented records on an arbitrary score scale. The final observed scores are 8 and 4 for two people; the third final score is missing, although that person had an earlier score of 6. An observed-only mean is 6. Carrying the earlier 6 into the final calculation also produces a mean of 6. Replacing the missing score with an assumed zero produces a mean of 4. The first two answers agree numerically, but they do not use the same information. Agreement in a final number can hide a different analytical operation.
The worksheet below deliberately uses a simple scale so the operation remains visible. It is not a reanalysis of the tadalafil data. To interpret any real missing-data method, identify which outcome it addresses, which earlier observations are eligible and what assumptions make the substitution useful. A rule documented for one questionnaire should not be silently extended to every measurement or participation count. Our guide to why a pill may seem not to work provides broader context for defining the problem before interpreting a summary. The statistical question still requires its own explicit measurement and analysis rule.
| Operation | Values entering calculation | Mean |
|---|---|---|
| Observed final values only | 8 and 4 | 6 |
| Carry earlier value for missing record | 8, 4 and earlier 6 | 6 |
| Assume zero for missing record | 8, 4 and assumed 0 | 4 |
Sources: Porst 2006
A head count cannot describe every kind of uncertainty
A total tells us how many entries meet a definition. To assess uncertainty around a treatment estimate, we also need to know what was measured and how values varied. Imagine two invented sets with the same number of observations and the same average. In one, values cluster closely around that average; in the other, they are widely dispersed. The count alone cannot distinguish these situations. Similarly, the number of completed visits does not reveal whether the underlying outcome was a continuous score, a yes-or-no response or repeated observations within each person.
That is why adding decorative error bars to a participation chart would answer no clearly defined statistical question. First specify the quantity being estimated and the analysis supporting its uncertainty interval. Precision should then remain attached to that quantity. A narrow interval around one group comparison would not, by itself, prove that the same comparison applies to a different population. These are separate questions: how uncertain is the estimate under its analysis, and how appropriate is its use elsewhere? Keeping both questions visible is more informative than treating a large enrollment figure as a universal certificate of reliability.
Sources: Porst 2006
Attendance, exposure and benefit need separate timelines
Draw an invented calendar with three rows: scheduled observations, recorded treatment exposure and measured outcomes. Place a visit mark in the first row. Nothing in that mark automatically fills the other two. A visit could collect several kinds of information, but the reader needs to know which information was actually recorded. Conversely, a missing visit mark does not logically specify every event between visits. This timetable is a way to organize questions about a study; it is not evidence of particular adherence patterns or undocumented events in the trial.
The exercise also clarifies the meaning of a treatment label. A schedule identifies an intervention, while the observation process determines what can be said about its use and results. Different formulations introduce another question about exactly what was studied. Our discussion of dissolvable medication and claims about speed is relevant to identifying that question, not permission to transfer results between products. When reading a claim, write down its route, formulation, schedule and outcome separately. An apparent match on one item does not establish a match on all four.
Sources: Porst 2006; FDA compounding guidance
Medical history belongs beside the experiment
Current CIALIS labeling describes daily ED doses of 2.5 mg initially and 5 mg based on efficacy and tolerability; this is label context, not an individual instruction. Organic nitrates and guanylate cyclase stimulators such as riociguat are contraindicated. Assessment considers underlying causes, cardiovascular status, kidney or liver conditions and interacting medicines. An erection lasting over four hours needs emergency care. Sudden vision loss requires stopping the medicine and medical attention; sudden hearing decrease or loss requires stopping it and prompt attention.
Those instructions answer a present-day clinical question that participant-flow arithmetic cannot resolve. As an editorial reading method, put personal circumstances in a separate column from study averages. A favorable group result cannot check a medication list, identify an unreported condition or determine whether a specific combination is appropriate. This does not require rejecting the experiment. It requires using it for the question it can address while taking other questions to the relevant clinical assessment. The guide to evaluating combination ED products can help organize what needs clarification. It should not be used to choose or combine medicines without a prescriber.
Sources: Cialis label
Keep product evidence and service promises in separate columns
FDA explains that compounded medicines are not FDA-approved and do not receive its premarket review for safety, effectiveness or quality. They can meet particular medical needs, while quality failures can cause serious harm. Separately, VIAGRA labeling states that the safety and efficacy of combining it with other PDE5 inhibitors or ED therapies are unestablished and that such combinations are not recommended. These are distinct source statements, not findings about a named seller or the performance of its service.
Our editorial interpretation is to use two separate checklists. One identifies the exact medicine, formulation and supporting clinical evidence. The other records documentary service terms such as what the written offer includes and which details remain unclear. The generic sildenafil and tadalafil review and Lemonaid tadalafil review are places to examine those documentary descriptions, not proof that either reproduces a trial’s treatment or outcomes. A provider-level effectiveness claim would require evidence about that provider and a clearly defined comparison. Linking a service page to a scientific article does not supply that evidence. Keep unanswered clinical and contractual questions visible rather than filling either gap with the reputation of the other.
Sources: FDA compounding guidance; Viagra label; Porst 2006
Questions about the evidence
Can a completion percentage tell me my chance of improvement?
No. Completion and improvement use different definitions. To describe improvement, first specify the outcome, the assessment time and the people included in the calculation. A participation percentage can help you understand follow-up, but substituting it for a response percentage changes the meaning of the result. The missing step is an outcome measurement, not a more confident interpretation of the same count.
Sources: Porst 2006
Does randomization make an eligibility rule unimportant?
It addresses a different part of the design. An eligibility rule determines who can enter the comparison; random assignment determines how admitted participants are allocated. When applying research elsewhere, ask what relevant characteristics are shared or different. The answer should be specific enough to investigate. Neither the word randomized nor a broad statement that everyone is different resolves that applicability question.
Sources: Porst 2006
Should missing results always be treated as failures?
That is an analysis choice, not an observation. It may be useful to examine what follows under a clearly stated assumption, but its interpretation depends on the question and the missing-data process. Compare the assumed-value calculation with the observed information and identify what would change under another assumption. Do not describe an assigned value as something a participant actually reported.
Sources: Porst 2006
Why can two analyses produce the same average and still differ?
An average compresses the calculation. Different sets of values can lead to the same final number, as the invented worksheet demonstrates. To interpret the answer, inspect which observations entered, which values were substituted and which denominator was used. Numerical agreement is informative only after those operations are understood; it does not establish that the underlying records or assumptions were identical.
Sources: Porst 2006
What is worth bringing to a discussion about this paper?
Bring the question you want answered, the study characteristic you think is relevant and the uncertainty you could not resolve. Keep these notes separate from any plan to change treatment. A discussion is easier to assess when it distinguishes an observed result, an analytical assumption and a personal circumstance requiring clinical evaluation. The paper can inform that conversation without settling every part of it.
Sources: Porst 2006; Cialis label
Editorial assessment
The most useful reading of participant flow is an organized account of membership and observation. Start with the population at each gate, attach every percentage to its denominator and identify the rule behind every substituted value. Then ask a separate question about applicability: which circumstances matter for the person or setting under consideration, and what evidence addresses them? The original examples here show how substantial numerical differences can arise without changing a single observed response. That is a reason to read calculations closely, not to dismiss research. A transparent interpretation preserves what was measured, labels what was assumed and leaves unresolved quantities open for further evidence rather than converting them into treatment promises.
Sources and access
- Oral sildenafil in the treatment of erectile dysfunction. Sildenafil Study Group.
Methods, results and funding passages inspected in retained full-text primary articles.
Checked 2026-10-25.
- Evaluation of the efficacy and safety of once-a-day dosing of tadalafil 5mg and 10mg in the treatment of erectile dysfunction: results of a multicenter, randomized, double-blind, placebo-controlled trial.
Methods, results and funding passages inspected in retained full-text primary articles.
Checked 2026-10-25.
- VIAGRA (sildenafil citrate) US prescribing information
Official prescribing information inspected.
Checked 2026-10-25.
- Cialis (tadalafil) prescribing information
Official prescribing information inspected.
Checked 2026-10-25.
- Understanding the risks of compounded drugs
Official FDA guidance inspected.
Checked 2026-10-25.
Important
The information on this website is provided for general education and does not constitute medical advice, diagnosis, or treatment. Erectile dysfunction can be the first sign of cardiovascular disease, diabetes, or hormonal disorders. Always consult a licensed physician about your individual circumstances, and never start, stop, or change a prescription based on what you read here.